The Problem
Hundreds of metrics, and no easy way to pick the right ones
At Marin Software, I led design on a search engine marketing platform that helped advertisers manage spend across publishers, accounts, and clients. Unlike the free tools publishers offered — which were designed to maximize the publishers' own revenue, not the advertiser's — Marin's value was cross-publisher visibility and automation. Where a team of ten could previously manage a few million in monthly spend, our platform let clients scale from $5–10M up to $100M+ per month by automating bidding against their actual business goals.
A critical part of that value was surfacing the right metrics. Publishers like Google, Yahoo, and Microsoft deliberately limited the metrics available in their tools, surfacing only what encouraged higher bids and more clicks. We built beyond that — giving users access to revenue, conversion, and ROI metrics that put performance in full business context. The phrase we used internally: "beyond the click."
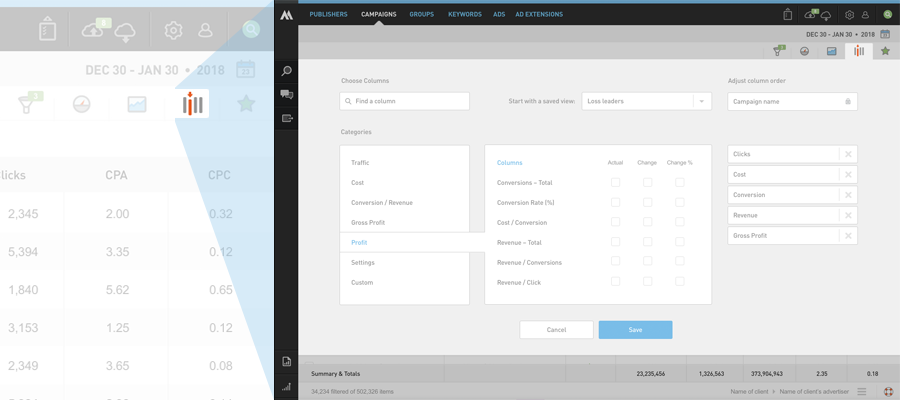
As our metric library grew past 30 columns, users needed a way to manage what they saw. The checkbox modal we'd built early on wasn't going to scale. We needed a column chooser that could grow with the product — and do it before Google built their own.
Context & Constraints
Building a pattern the industry didn't have yet
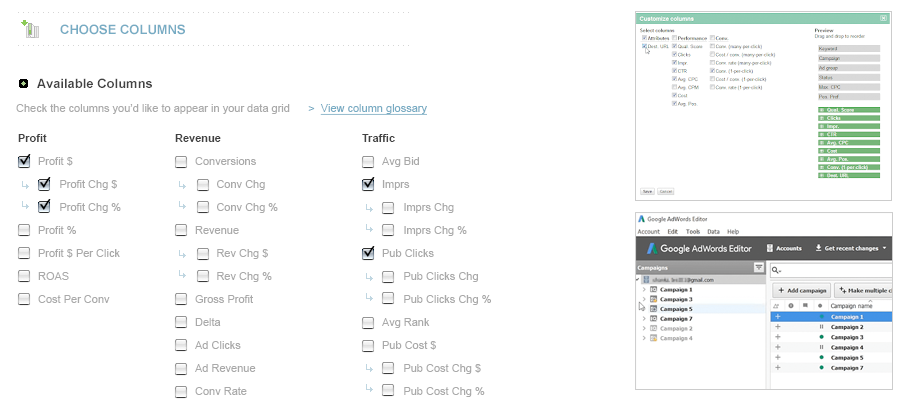
Back in 2006, column choosers were essentially nonexistent in ad management tools. None of the major publishers offered one. The few we found in adjacent tools used simple checkbox modals — the same pattern we were already outgrowing.
This was also a moment of broader UI evolution at Marin. I was deep in exploration work to update the product's overall look and feel, but we made a deliberate call: ship the column chooser fast, iterate later. Competitive timing mattered more than perfection.
Users & Audience
Power users who live in the data all day
Our primary users were search advertising power users — part analyst, part marketer — who lived in the product 3–5 hours a day. They were fluent in Google's tools, comfortable with Excel for cross-publisher analysis, and accustomed to high-density data interfaces. They needed speed and precision, not hand-holding.
Secondary audiences included internal customer success and product teams, marketing managers, and executive stakeholders.
Team & Role
A small team, with design owned end to end
I worked with our Director of Product Management and a front-end developer. I owned the design — layout, UI components, interaction patterns, and UX direction. The developer and I had a close working relationship, having built out most of the product's front-end together.
The Design Process
Audit, explore, test, and refine with customers
Our research started with a thorough audit of publisher tools and display advertising platforms (including DoubleClick and SDC, from my agency background). The finding was consistent: nobody had solved this well. That was both a challenge and an opportunity.
I sketched several approaches and landed on a core organizing principle: categorization. Rather than forcing users to scroll a flat list of 100+ metrics, we grouped them into logical buckets. This served two purposes — it made discovery faster, and it helped users find metrics they didn't know existed.
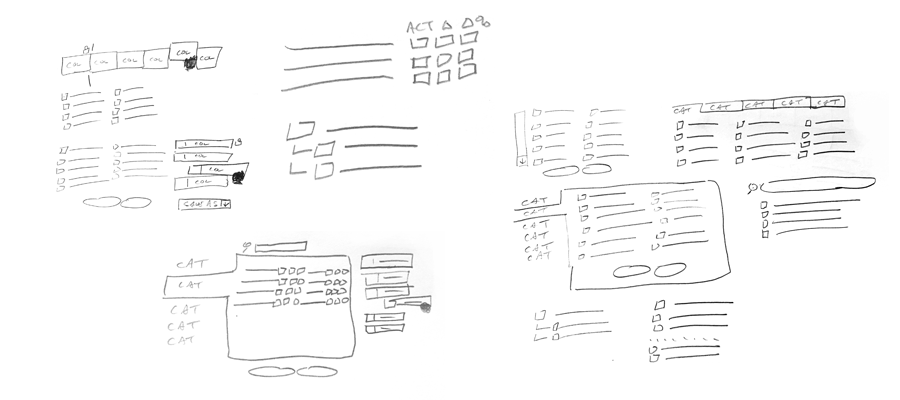
We explored three or four categorization schemes, tested the strongest candidates with our Customer Advisory Board and internal customer success team, and synthesized the feedback — which, as expected, pulled in multiple directions — into a workable direction.
One interaction problem became clear early in the process: if users had to select columns in the modal and then navigate back to the grid to reorder them, the back-and-forth would be frustrating. We resolved this by building column reordering directly into the chooser — select and sequence in one place.
We also added search within the chooser, giving power users a fast path to any metric by name.
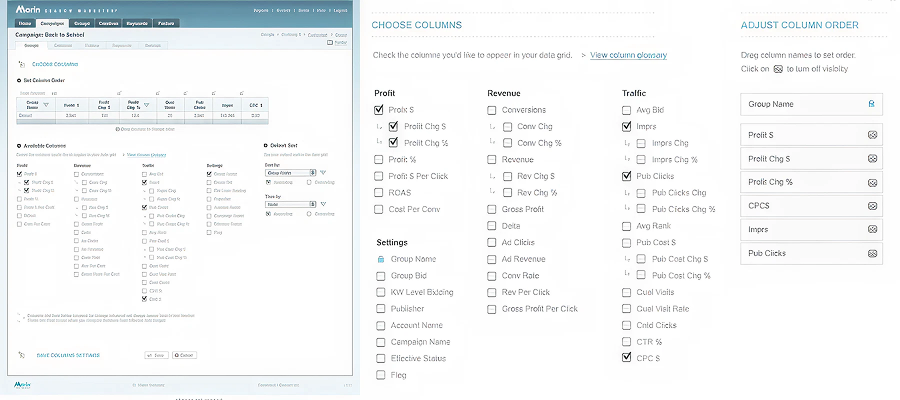
I worked with our front-end developer to get the look and interactivity pretty tight including ways to change the column order, displaying the found search results, and how to show/hide the columns.
Outcome
Strong adoption, ahead of the publishers
The upgraded column chooser launched to strong adoption. At the time, users had no way to show or hide columns directly from the grid, so the time savings were immediate and tangible. It also became a sales asset — the breadth of our metric library, now navigable and discoverable, reinforced our "beyond the click" positioning against publisher tools.
Key Results:
Columns per saved view: 4.2 → 8.7 — A 2x increase post-launch, indicating users were genuinely customizing their workspaces rather than accepting defaults — a strong signal the categorization and search features were working.
Grid screen engagement: ↑ Active users — Measurable increase in active users on the core reporting screen post-launch, validating that a more powerful column chooser drove deeper engagement with the product's most-used feature.
Sales win rate vs. Google: ↑ 20–30% — In head-to-head evaluations against Google's tools — which still relied on a limited checkbox modal surfacing only publisher-favorable metrics — our win rate increased meaningfully. The ability to demonstrate a richer, more flexible view of cross-publisher performance resonated strongly with prospects who had outgrown what the publishers were willing to show them.
We also tracked chooser interactions via Google Analytics click events and found usage patterns were consistent across the metric set — a reassuring signal that the categorization was working and users weren't clustering around just a few familiar options.
When Google eventually released their own column picker — a checkbox modal that closely resembled our earlier version — we were already shipping the next iteration. By the time our redesigned UI launched in 2017, the column chooser was a highlight.
Lesson Learned
Ship iteratively, and design for discoverability
The project reinforced a few things I carry forward: iterative releases let you stay competitive without waiting for the "perfect" version, and building for discoverability can be as valuable as building for speed. We were able to release right after Google shipped their version, then quickly advance past it — a competitive dynamic that validated the iterative, agile approach over a longer waterfall build.